Flow Cytometry Guide (FACS Analysis)
Categories
Originally developed in the late 1960s, flow cytometry is a popular analytical cell-biology technique that utilizes light to count and profile cells in a heterogenous fluid mixture. Flow cytometry is a particularly powerful method because it allows a researcher to rapidly, accurately, and simply collect data related to many parameters from a heterogeneous fluid mixture containing live cells.
Flow cytometry is used extensively throughout the life and biomedical sciences, and can be applied in any scenario where a researcher needs to rapidly profile a large population of loose cells in a liquid media. For example, in immunology flow cytometry is used to identify, separate, and characterize various immune cell subtypes by virtue of their size and morphology.
When additional information is required, antibodies tagged with fluorescent dyes, and raised against highly specific cell surface antigens (e.g. clusters of differentiation or CD markers) can be used to better identify and segregate specific sub-populations within a larger group.
In a Flow Cytometer:
- Sample cells are passed through a narrow channel one at a time.
- Light is used to illuminate the cells in the channel.
- A series of sensors detect the types of light that are refracted or emitted from the cells.
- Data acquired by the sensors is compiled and integrated to build a comprehensive picture of the sample.
Different Types of Light used in a Flow Cytometry Experiment
A flow cytometer uses refracted or emitted light to count and identify cells. Learn about different types of light used in a flow cytometry experiment in the following figures.
Forward Scatter
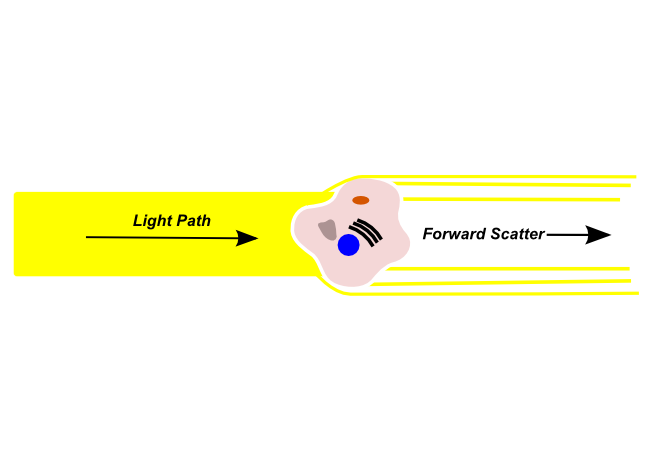
Forward Scatter
Forward scattered light is refracted by a cell in the flow channel and continues along in the light path (i.e. The same direction that the light was originally traveling). Forward scattered light is detected by a sensor in the light path, and is typically used to identify particle size.
Forward scattered light is most commonly used to detect the size of the object in the light path. Larger objects will produce more forward scattered light than smaller objects, and larger cells will have a stronger forward scatter signal
Side Scatter
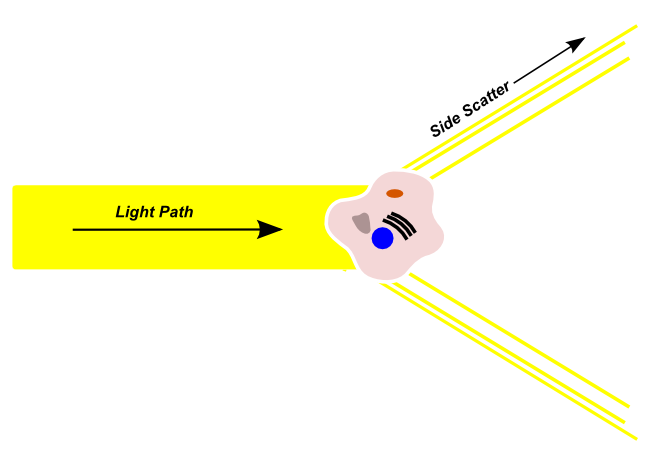
Side Scatter
Side scattered light light passes from the illumination source into the flow channel, is refracted by cells in a direction that is outside of the original light path. Side-scattered light is detected by a sensor that is orthogonal to the original light path.
Side-scattered light is usually used to make a determination regarding the granularity and complexity of the cell in the light path. Highly granular cells with a large amount of internal complexity, like neutrophils, will produce more side-scattered light, and a higher side-scatter signal than cells with a low-granularity and complexity.
Fluorescence Emission
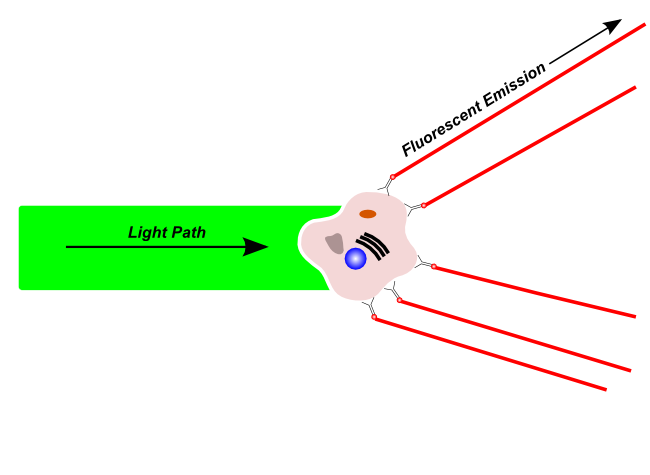
Fluorescence Emission
Fluorescent light is emitted by fluorescent molecules after excitation by a compatible wavelength laser. Fluorescent light may originate from naturally fluorescing materials in the cell, or may originate from fluorescent dyes or fluorescence-tagged antibodies that have been used to label a specific structure on the cell.
Multiparametric Analysis
Multiparametric Analysis
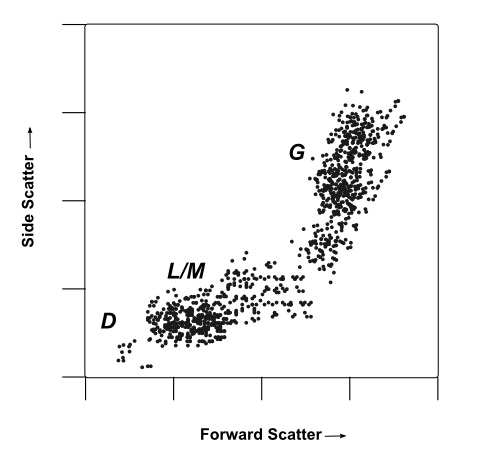
A mock flow cytometry dot-plot, plotting forward vs side-scattered from a population of leukocytes. Cell populations are marked by their probable identity:
D Presumed debris, very small items with low low forward- and side- scatter.
L/M Probable leukocytes/monocytes, small to medium cells with low internal complexity/granularity. These cells generate a medium forward-scatter and low side-scatter signal intensity
G Probable granulocytes, large cells with high internal complexity/granularity. These cells generate high forward- and side-scatter signals.
While some identities can be confirmed by forward and side-scatter profiles, labeling with a cell-type specific marker always provides greater resolution and certainty when profiling complex heterogeneous populations of cells.
For example, in the plot above, a researcher may be able to distinguish between granulocytes and lymphocytes using forward and side-scattered light. However, three classes of granulocytes (neutrophils, basophils, and eosinophils) are very similar in size and structure, giving them similar light-scattering properties. In this instance, neutrophils could be selectively labeled by virtue of their expression a neutrophil specific marker like ELANE.
FACS: Sorting Cells based on Flow Cytometry Data
The terms flow cytometry and fluorescence-activated cell sorting (FACS) are often used interchangeably. In practice, there are differences between the two methods. FACS is a derivative of flow cytometry that adds an exceptional degree of functionality. Using FACS a researcher can physically sort a heterogeneous mixture of cells into different populations. By using highly specific antibodies tagged with fluorescent dyes, a researcher can perform FACS analysis and simultaneously gather data on, and sort a sample by a nearly limitless number of different parameters.
In a FACS Experiment:
- Forward-scatter, side-scatter, and fluorescent data is collected, as in conventional flow cytometry.
- User-defined parameters provide information on how cells should be sorted.
- Based on these parameters, the FACS machine uses an electrode to impose an electrical charge on each cell.
- Upon exiting the flow chamber, electromagnets will sort cells by charge into separate vessels.
What does Flow Cytometry Data look like?
In a flow cytometry experiment, every cell that passes through the flow cytometer and is detected will be classified as a distinct event. Additionally, each type of light that is detected by the flow cytometer (forward-scatter, side-scatter, and each wavelength of fluorescence emission) will be assigned its own unique channel. Flow cytometry data will plot each event independently, and will represent the signal intensity of light detected in each channel for every event.
Flow cytometry data is typically represented in one of two ways: histograms, which measure or compare only a single parameter, and dot-plots which compare 2 or 3 parameters simultaneously on a two- or three-dimensional scatter-plot.
A histogram typically plots the intensity detected in a single channel along one axis and the number of events detected at that intensity is in a separate axis. A large number of events detected at one particular intensity will be displayed as a spike on the histogram. By contrast, in a dot plot, each event is represented as a single point on a scatter-plot. Intensity of 2 different channels (or 3 different channels in a three-dimensnal plot) are represented along the various axes. Events with similar intensities will cluster together in the same region on the scatter-plot.
Note: In dot-plot data, large samples will often result in a heavy cluster of events represented in the same region of the plot. There are many methods for adding additional resolution to these regions. For example, a heat map, as in the example above, may be used to provide information about event density in a given region of the plot.
Histograms and dot-plots both provide different advantages for flow cytometry data analysis. Choosing how best to represent your data can help ensure that it tells a complete story in a simple, comprehensible format.
Histograms
- Are fast to read and easy to understand.
- Are most useful when only one parameter (e.g. intensity from a single fluorescent channel) is important.
- Usual representation includes the intensity of a single channel (horizontal axis) vs number of detected events (vertical axis).
- Multiple overlaid histograms can be used to compare a single parameter from two different sample populations (e.g. experimental vs. control).
Dot-plots
- Are most useful when you need to compare multiparametric data (e.g. Intensity of side-scatter vs forward-scatter channels).
- Can be two- or three-dimensional
- Intensity of each channel is represented on its own axis.
- Each distinct event is represented at a single dot.
- Are a more complex, more illustrative representation of data.
Dot-plots and histograms are not mutually exclusive, and most complex flow cytometry experiments will make use of multiple plots to display rich, multi-parametric data on a sample. In many instances, more than three parameters need to be plotted simultaneously. In this case, a data-analysis technique known as gating can help to give additional resolution and flexibility, allowing for analysis of a nearly limitless quantity of parameters simultaneously across several different scatter-plots and histograms.
Gating adds Resolution to Flow Cytometry Data
In short, gating is a method for selecting cells from a flow cytometry experiment that you want to analyze in more specific detail. Gating allows a researcher to gather and display more information about a subpopulation of cells than could normally be displayed on a 2- or 3-dimensional dot-plot.
Gating adds resolution to a flow cytometry experiment, and allows for simultaneous analysis of a nearly limitless number of different parameters (channels).
In a gated Flow Cytometry Experiment:
- A user collects flow cytometry data from one or more channels on a dot-plot.
- Based on the data acquired, the user draws a gate box selecting a subpopulation of cells for further analysis.
- The subpopulation of cells within the gate will be specifically highlighted on other plots displaying information from alternate channels.
Gates add an incredible amount of flexibility to flow cytometry, granting up to single-cell resolution for each channel available to the researcher. Multiple gates can be established for a single scatter-plot, and gates can be "stacked" and combined (i.e. A subpopulation of cells gated for in channels 1 and 2 can be further gated for channels 3 and 4 to allow for more specificity and deeper analysis).
An example of gating
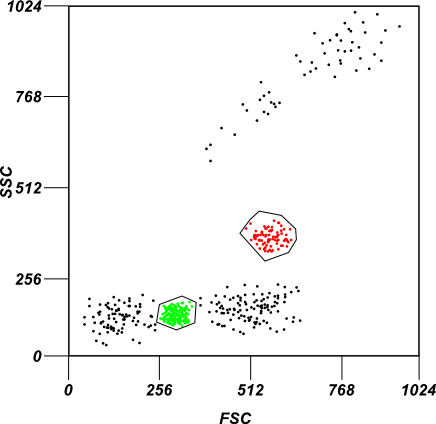
A mock example of gating. In the image two subpopulations of cells are gated based on their forward and side-scatter intensity profiles.
The same population of cells are highlighted by a cohesive color scheme when analyzing two different channels measuring fluorescent intensity in the image above.
A note on Compensation
Spillover from one channel into another one can cause falsely as positive identified signals. Spillover is the artefactual signal that one fluorescent dye can cause in the channel of another fluorophore as a function of its relative brightness and emission spectrum. This is where compensation comes into play. Compensation is a procedure that isolates the signal from one particular channel from the other channels used in the same experiment. FITC e.g. has its emission peak in the green range of the electromagnetic spectrum. It does however also fluoresce in the yellow channel where PE emits light. Simply put, compensation subtracts the FITC signal from the PE channel.
This signal in the “wrong” channel is subtracted from the signal caused by the fluorophore of interest. In the above sample, the ratio of the green and the yellow component at a given excitation wavelength is constant for FITC. It is thus possible to infer the amount of unspecific yellow FITC signal in the PE channel from the measurement in the green channel using the constant compensation coefficients. The same is true for the spillover from the PE into the FITC channel.
Additional Reading
- Fluorescent Conjugated Antibodies and Kits Sorted after emission peak
- Introduction to Fluorescence Focus on life-sciences usage

Offered pre- and post-sales consultation and support to antibodies-online customers. Provided troubleshooting and technical assistance with proteomics and genomics experiments. Composed and distributed cross-channel digital marketing campaigns.
Go to author page


